UNITED NATIONS ECLAC – LATAM & Caribbean preliminary numbers / information, refreshed as of July 2021.
South America
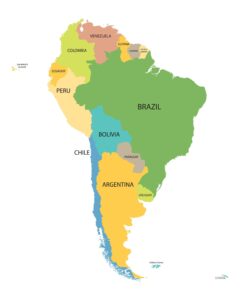
Following states are all members of the United Nations[5] and current or former members of the Union of South American Nations.[6]
| Flag | Map | English short and formal names, and ISO code[7][8][9] | Domestic short and formal names [7][8] |
Capital [9][10][11] |
Population [12] |
Area [13] |
|---|---|---|---|---|---|---|
| Argentina
Argentine Republic ARG |
Spanish: Argentina — República Argentina | Buenos Aires
Spanish: Ciudad de Buenos Aires |
44,361,150 | 2,780,400 km2 (1,073,518 sq mi) | ||
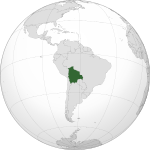
| Bolivia
Plurinational State of Bolivia BOL |
Spanish: Bolivia — Estado Plurinacional de Bolivia
Quechua: Buliwya Aymara: Wuliwya |
Sucre (official) and La Paz (seat of government)Spanish: Sucre[n 1] |
11,353,142 | 1,098,581 km2 (424,164 sq mi) | ||
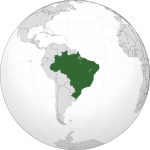
| Brazil
Federative Republic of Brazil BRA |
Portuguese: Brasil — República Federativa do Brasil | Brasília
Portuguese: Brasília |
209,469,323 | 8,514,877 km2 (3,287,612 sq mi) | ||
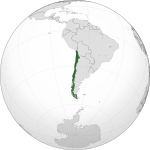
| Chile [n 2]
Republic of Chile CHL |
Spanish: Chile — República de Chile | Santiago[n 3]
Spanish: Santiago |
18,729,160 | 756,102 km2 (291,933 sq mi) | ||
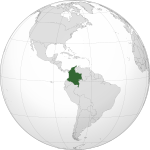
| Colombia
Republic of Colombia COL |
Spanish: Colombia — República de Colombia | Bogotá / Santa Fe de Bogotá
Spanish: Bogotá |
49,661,048 | 1,138,910 km2 (439,736 sq mi) | ||
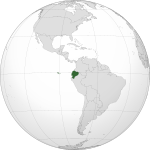
| Ecuador
Republic of Ecuador ECU |
Spanish: Ecuador — República del Ecuador
Quechua: Ikwadur |
Quito
Spanish: Quito |
17,084,358 | 283,561 km2 (109,484 sq mi) | ||
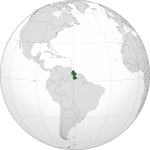
| Guyana
Co-operative Republic of Guyana GUY |
English: Guyana — Co-operative Republic of Guyana | Georgetown
English: Georgetown |
779,006 | 214,969 km2 (83,000 sq mi) | ||
| Paraguay
Republic of Paraguay PRY |
Spanish: Paraguay — República del Paraguay
Guarani: Paraguai — Tetã Paraguai |
Asunción
Spanish: Asunción |
6,956,066 | 406,752 km2 (157,048 sq mi) | ||
| Peru
Republic of Peru PER |
Spanish: Perú — República del Perú
Quechua: Piruw Aymara: Piruw |
Lima
Spanish: Lima |
31,989,260 | 1,285,216 km2 (496,225 sq mi) | ||
| Suriname
Republic of Suriname SUR |
Dutch: Suriname — Republiek Suriname | Paramaribo
Dutch: Paramaribo |
575,990 | 163,820 km2 (63,251 sq mi) | ||
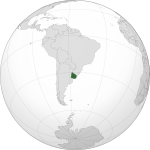
| Uruguay
Eastern Republic of Uruguay[n 4] URY |
Spanish: Uruguay — República Oriental del Uruguay | Montevideo
Spanish: Montevideo |
3,449,285 | 176,215 km2 (68,037 sq mi) | ||
| Venezuela
Bolivarian Republic of Venezuela VEN |
Spanish: Venezuela — República Bolivariana de Venezuela | Caracas
Spanish: Caracas |
28,887,118 | 912,050 km2 (352,144 sq mi) |
Since the end of the economic crisis in Brazil and Argentina that occurred in the period from 1998 to 2002, which has led to economic recession, rising unemployment and falling population income, the industrial and service sectors have been recovering rapidly. All of South America after this period has been recovering and showing good signs of economic stability, with controlled inflation and exchange rates, continuous growth, a decrease in social inequality and unemployment–factors that favor industry.[92]
The main industries are: electronics, textiles, food, automotive, metallurgy, aviation, naval, clothing, beverage, steel, tobacco, timber, chemical, among others. Exports reach almost US$400 billion annually, with Brazil accounting for half of this.[92]
The economic gap between the rich and poor in most South American nations is larger than on most other continents. The richest 10% receive over 40% of the nation’s income in Bolivia, Brazil, Chile, Colombia, and Paraguay,[94] while the poorest 20% receive 4% or less in Bolivia, Brazil, and Colombia.[95] This wide gap can be seen in many large South American cities where makeshift shacks and slums lie in the vicinity of skyscrapers and upper-class luxury apartments; nearly one in nine South Americans live on less than $2 per day (on a purchasing power parity basis).[96]
| Country | GDP (nominal) in 2017 (in millions of dollars)[97] |
GDP (PPP) in 2017 (in millions of dollars)[97] |
GDP (PPP) per capita in 2017[97] |
Merchandise exports ($bn), 2011[91] |
HDI in 2017 (rank)[98] |
Percent with less than $2 (PPP) per person per day |
|---|---|---|---|---|---|---|
| Argentina | 628,935 | 912,816 | 20,707 | 83.7 | 0.825 | 2.6 |
| Bolivia | 39,267 | 83,608 | 7,552 | 9.1 | 0.693 | 24.9 |
| Brazil | 2,140,940 | 3,216,031 | 15,485 | 250.8 | 0.759 | 10.8 |
| Chile | 251,220 | 455,941 | 24,796 | 86.1 | 0.845 | 2.7 |
| Colombia | 306,439 | 720,151 | 14,609 | 56.5 | 0.747 | 15.8 |
| Ecuador | 97,362 | 184,629 | 11,004 | 22.3 | 0.752 | 10.6 |
| Falkland Islands (UK) | 206.4 | 206.4 | 70,800 | 0.26 | ||
| French Guiana(France) | 4,456 | 4,456 | 19,728 | 1.3 | ||
| Guyana | 3,591 | 6,398 | 8,306 | 0.9 | 0.654 | 18.0 |
| Paraguay | 28,743 | 68,005 | 9,779 | 9.8 | 0.702 | 13.2 |
| Peru | 207,072 | 429,711 | 13,501 | 46.3 | 0.750 | 12.7 |
| Suriname | 3,641 | 7,961 | 13,934 | 1.6 | 0.720 | 27.2 |
| Uruguay | 58,123 | 77,800 | 22,271 | 8.0 | 0.804 | 2.2 |
| Venezuela | 251,589 | 404,109 | 12,856 | 92.6 | 0.761 | 12.9 |
| Total | 3,836,569 | 6,642,623 | 17,852 | 669.1 | 0.772 | 11.3 |
Economically largest cities as of 2014
| Rank | City | Country | GDP in Int$ bn[101] | Population (mil)[101] | GDP per capita |
|---|---|---|---|---|---|
| 1 | São Paulo | Brazil | $430 | 20,847,500 | $20,650 |
| 2 | Buenos Aires | Argentina | $315 | 13,381,800 | $23,606 |
| 3 | Lima | Peru | $176 | 10,674,100 | $16,530 |
| 4 | Rio de Janeiro | Brazil | $176 | 12,460,200 | $14,176 |
| 5 | Santiago | Chile | $171 | 7,164,400 | $32,929 |
| 6 | Bogotá | Colombia | $160 | 9,135,800 | $17,497 |
| 7 | Brasília | Brazil | $141 | 3,976,500 | $35,689 |
| 8 | Belo Horizonte | Brazil | $84 | 5,595,800 | $15,134 |
| 9 | Porto Alegre | Brazil | $62 | 4,120,900 | $15,078 |
| 10 | Campinas | Brazil | $59 | 2,854,200 | $20,759 |
Economic statistics
| Country/Territory | Currency | GDP (PPP) per capita[n 8] (2008 est. in U.S. dollars) |
Notes |
|---|---|---|---|
| Argentina | Argentine peso | 14,200 | [16] |
| Bolivia | Boliviano | 4,500 | [17] |
| Bouvet Island† (Norway) | Norwegian Krone | 0 | |
| Brazil | Brazilian real | 10,100 | [18] |
| Chile | Chilean peso | 14,900 | [19] |
| Colombia | Colombian peso | 8,900 | [20] |
| Ecuador | United States dollar | 7,500 | [21] |
| Falkland Islands (United Kingdom) | Falkland Islands pound | 35,400 (2002 est.) | [22] |
| French Guiana (France) | Euro | 6,000 (2001 est.) | [23][24] |
| Guyana | Guyanese dollar | 3,900 | [25] |
| Paraguay | Paraguayan guaraní | 4,200 | [26] |
| Peru | Peruvian sol | 8,400 | [27] |
| South Georgia and the South Sandwich Islands† (United Kingdom) |
Falkland Islands Pound | 0 | |
| Suriname | Surinamese dollar | 8,900 | [28] |
| Uruguay | Uruguayan peso | 12,200 | [29] |
| Venezuela | Venezuelan bolívar | 13,500 | [30] |
The top ten largest South American metropolitan areas by population as of 2015, based on national census numbers from each country:
| Metro Area | Population | Area | Country |
|---|---|---|---|
| São Paulo | 21,090,792 | 7,947 km2 (3,068 sq mi) | Brazil |
| Buenos Aires | 13,693,657 | 3,830 km2 (1,480 sq mi) | Argentina |
| Rio de Janeiro | 13,131,431 | 6,744 km2 (2,604 sq mi) | Brazil |
| Lima | 9,904,727 | 2,819 km2 (1,088 sq mi) | Peru |
| Bogotá | 9,800,225 | 4,200 km2 (1,600 sq mi) | Colombia |
| Santiago | 6,683,852 | 15,403 km2 (5,947 sq mi) | Chile |
| Belo Horizonte | 5,829,923 | 9,467 km2 (3,655 sq mi) | Brazil |
| Caracas | 5,322,310 | 4,715 km2 (1,820 sq mi) | Venezuela |
| Porto Alegre | 4,258,926 | 10,232 km2 (3,951 sq mi) | Brazil |
| Brasilia | 4,201,737 | 56,433 km2 (21,789 sq mi) | Brazil |
Central America
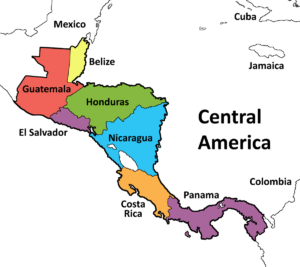
| Country | GDP (nominal)[45][a] | GDP (nominal) per capita[51][52] | GDP (PPP)[46][a] |
|---|---|---|---|
| Belize | 1,552 | $4,602 | 2,914 |
| Costa Rica | 44,313 | $10,432 | 57,955 |
| El Salvador | 24,421 | $3,875 | 46,050 |
| Guatemala | 50,303 | $3,512 | 78,012 |
| Honduras | 18,320 | $2,323 | 37,408 |
| Nicaragua | 7,695 | $1,839 | 19,827 |
| Panama | 34,517 | $10,838 | 55,124 |
The Caribbean
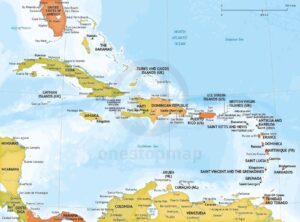
- Aruba
- Bahamas
- Barbados
- Belize
- Cayman Islands (U.K.)
- Curaçao (Netherlands)
- Dominican Republic
- Guyana
- Haiti
- Jamaica
- Organisation of Eastern Caribbean States (OECS)
- Antigua and Barbuda
- Dominica
- Grenada
- Saint Kitts and Nevis
- Saint Lucia
- Saint Vincent and the Grenadines
- Sint Maarten
- Suriname
- Trinidad and Tobago
- Turks and Caicos
The Caribbean is a diverse region with significant economic potential and growth opportunities. Gross National Income (GNI) per capita varies from around US$800 to over US$30,000 and most countries rely primarily on tourism, while some on commodity exports.
With its stunning scenery and vibrant cultures, the Caribbean is one of the world’s top tourist destinations. Sustainable use of ocean resources, known as the “blue economy,” offers potential for economic diversification, while preserving the region’s environment, as well as further development of other sectors with potential for growth.
Many small economies, including those that are tourism-dependent, were maintaining a positive growth rate prior to the onset of the COVID-19 pandemic. The Caribbean has been badly impacted by the near halt in tourism. The Caribbean economy contracted an estimated 8.6% in 2020, and by 12.6% excluding Guyana. Many jobs are affected, and a recent high frequency phone survey in one of the Caribbean small states suggests that poverty headcounts are rising, though the magnitude and duration of this increase will depend on the pace of economic recovery. The progression of the pandemic and vaccination efforts will have a major impact on the speed and scope of recovery.
Caribbean countries are extremely vulnerable to climate change and natural disasters. Extreme weather events are common – the region experienced nine hurricanes at Category 3 and above in 2019-2020, and a record number of named storms in the 2020 hurricane season. When a hurricane strikes, it can wipe out more than the entire annual GDP of a small island and it is often the poorest that suffer the most. Major hurricanes include Irma and Maria in 2017, and Dorian in 2019. In April 2021, the eruption of the La Soufrière volcano in Saint Vincent and the Grenadines has required mass evacuations, and is having widespread impacts on the country’s people, infrastructure, and economy.
Building fiscal and financial resilience and investing in preparedness – be it physical, health-related, or social safety nets – are critical to reducing the large human and economic costs caused by climate change. to the Caribbean also aims to develop new sources of economic growth and high productivity jobs, which will require investing in people and climate adaptation, improving the investment climate and connectivity, and safeguarding the environment.
Last Updated: Apr 22, 2021


